



The figure presents the time-space diagram for when the traffic on a highway is suddenly stopped for a certain time and then released. Which of the following statements are true?
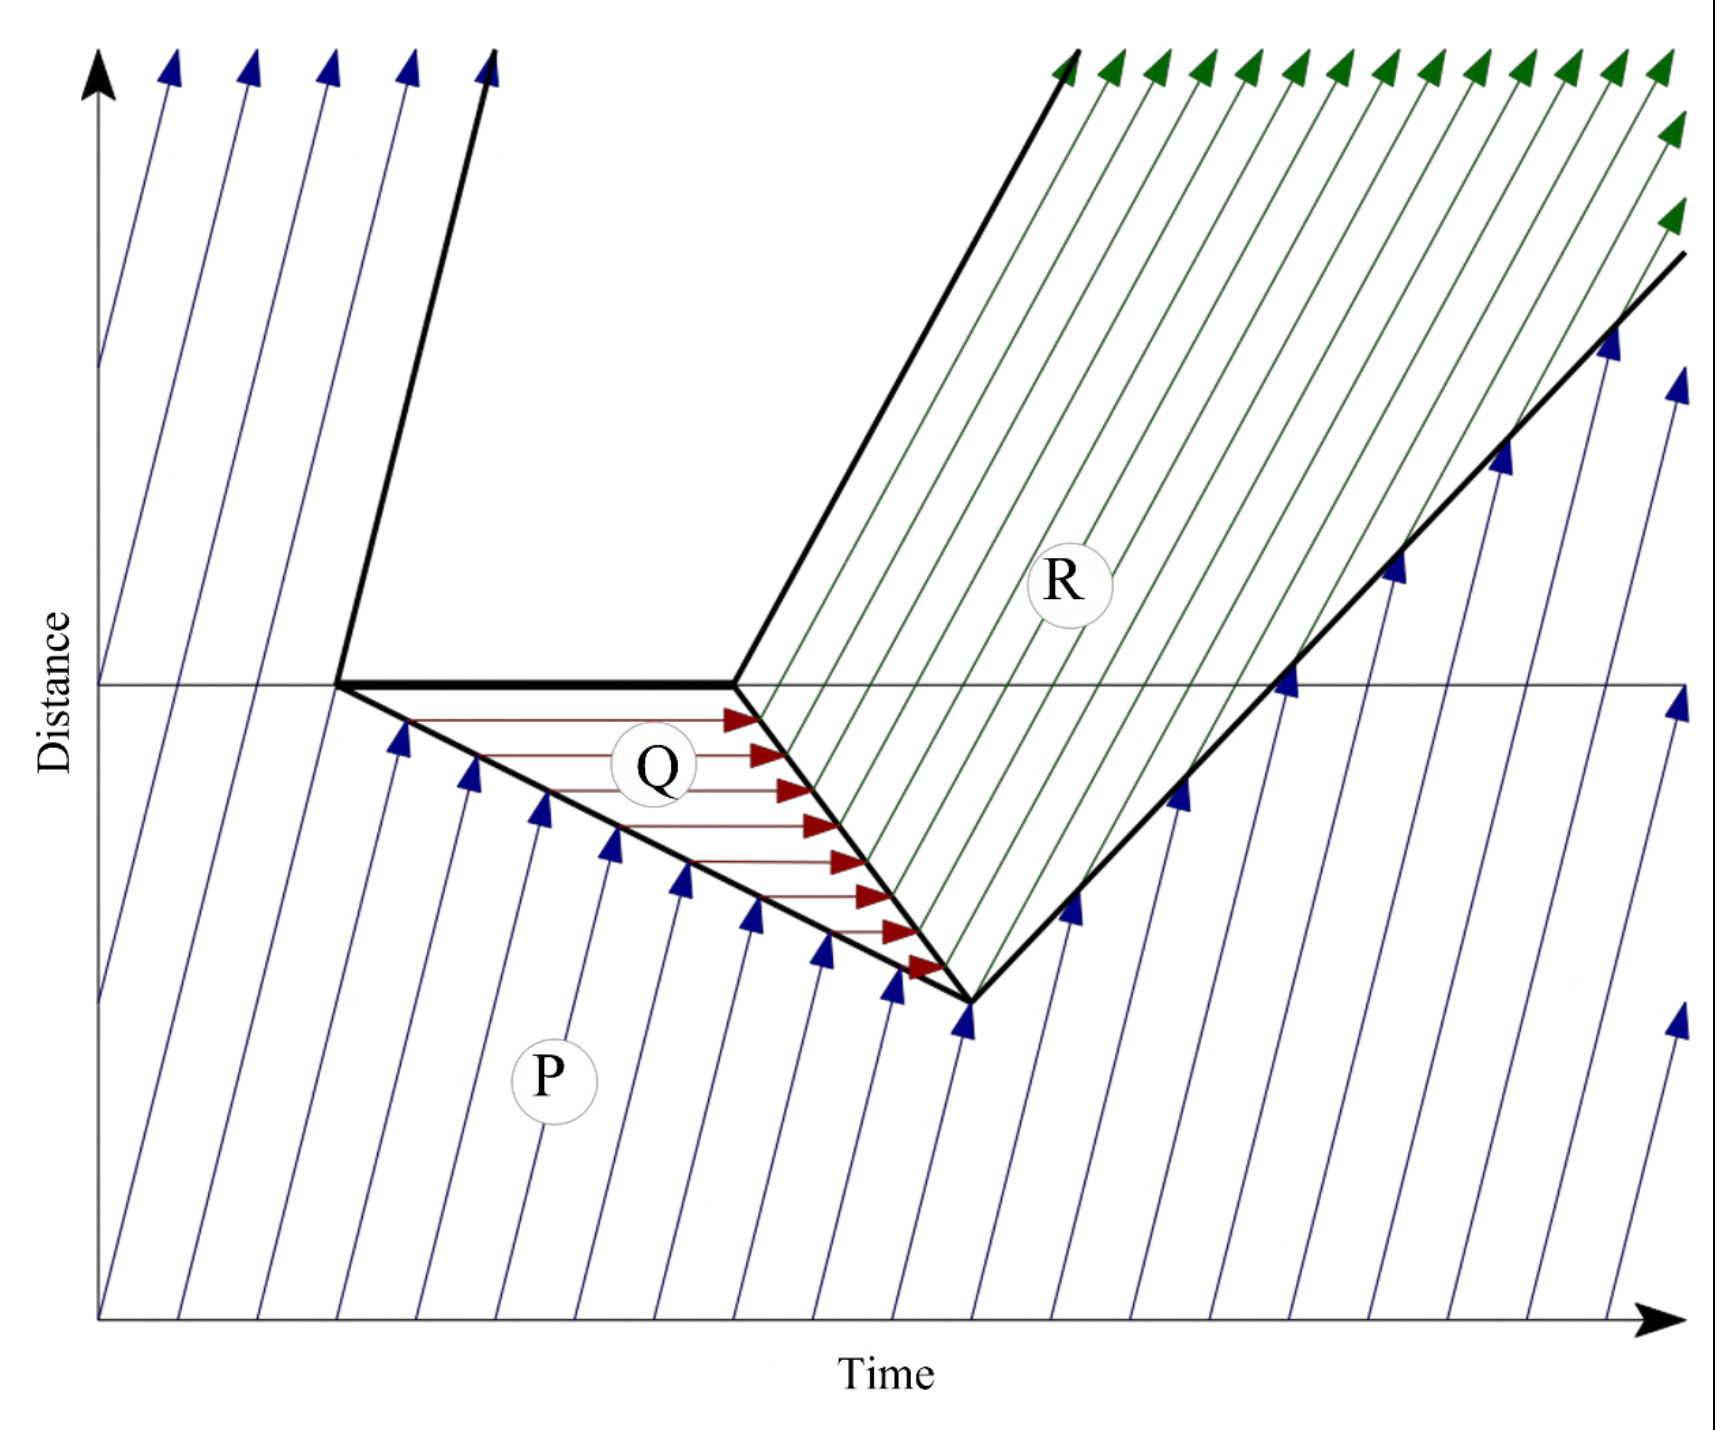
- ASpeed is higher in Region R than in Region P
- BVolume is lower in Region Q than in Region P
- CVolume is higher in Region R than in Region P
- DDensity is higher in Region Q than in Region R