


GATE CS 2017 (Forenoon) — Question 65

Quantitative AptitudeGraphical Representations (2D and 3D Plots, Maps, Tables)MCQ2 marks · −2/3 if wrongMedium

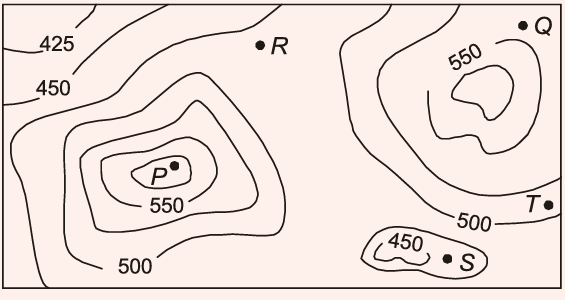
A contour line joins locations having the same height above the mean sea level. The following is a contour plot of a geographical region. Contour lines are shown at 25 m intervals in this plot. If in a flood, the water level rises to 525 m, which of the villages \(P\), \(Q\), \(R\), \(S\), \(T\) get submerged?
Question image
  1. A
    \(P\), \(Q\)
  2. B
    \(P\), \(Q\), \(T\)
  3. C
    \(R\), \(S\), \(T\)
  4. D
    \(Q\), \(R\), \(S\)
Practise the full 2017-FN paper
Challenge a friend: WhatsApp Telegram
From RENYXERAWhat rank do your marks get?GATE score, likely All-India Rank and qualifying marks for your category.
Practise more on Graphical Representations (2D and 3D Plots, Maps, Tables)Timed, in the real exam interface · free to start

A GATE question every morning

One real past-paper question every morning for your branch, answer hidden until you tap. Free on Telegram.

Join
Stuck? Ask in the student group