



GATE CS 2024 (Forenoon) — Question 8

Quantitative AptitudeData Interpretation (Bar Graphs, Pie Charts, Histograms)MCQ2 marks · −2/3 if wrongMedium

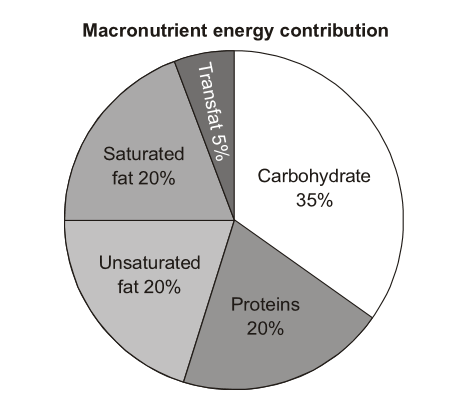
The pie chart present the percentage contribution of different macronutrients to a typical 2,000 kcal diet of a person.
Question image
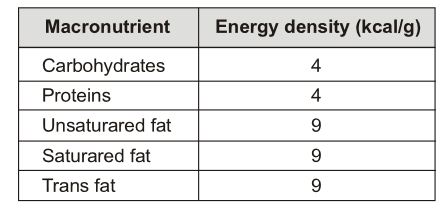
The typical energy density (kcal/g) of these macoutrients is given in the table.
Question image
The total fat (all three types), in grams, this person consumes is
  1. A
    44.4
  2. B
    77.8
  3. C
    100
  4. D
    3,600
Practise the full 2024-FN paper
Challenge a friend: WhatsApp Telegram
From RENYXERAFree All-India Mock — every SundayA full GATE CS paper, exactly 180 minutes, ranked across India with your GATE score.
Practise more on Data Interpretation (Bar Graphs, Pie Charts, Histograms)Timed, in the real exam interface · free to start

A GATE question every morning

One real past-paper question every morning for your branch, answer hidden until you tap. Free on Telegram.

Join
Stuck? Ask in the student group