



The bar chart shows the data for the percentage of population falling into different categories based on Body Mass Index (BMI) in 2003 and 2023.
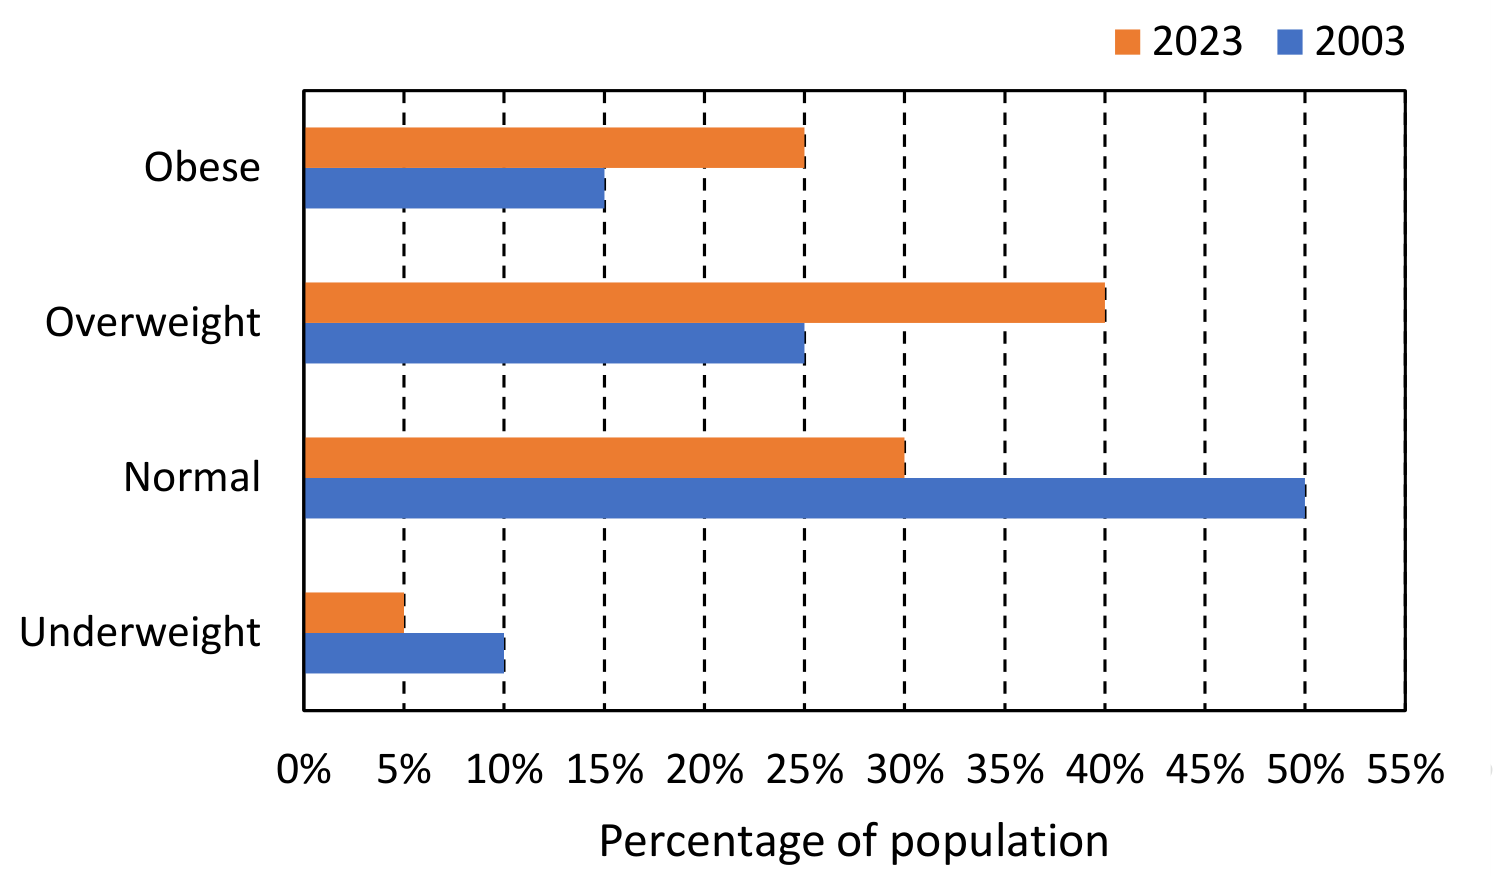 Based on the data provided, which one of the following options is INCORRECT?
- AThe ratio of the percentage of population falling into overweight category to the percentage of population falling into normal category has increased in 20 years.
- BThe ratio of the percentage of population falling into underweight category to the percentage of population falling into normal category has decreased in 20 years.
- CThe ratio of the percentage of population falling into obese category to the percentage of population falling into normal category has decreased in 20 years.
- DThe percentage of population falling into normal category has decreased in 20 years.